


Balancing Public and Private Investment
Cities should be doing the math to ensure that public investment is creating more community wealth

Thank you for reading the Strong Towns Seacoast Newsletter. A while back I asked one of our members to help me create a map of Dover’s zoning codes with some statistics around each of them so that we can get a feel for how zoning impacts our cities. That map is done and it can help us identify where public investment can get the most return for the city. We can look at some insights from the map in this article, but first let me give you the details for the next in-person meeting.
Meeting #11 Details
Saturday, July 13th 10:30AM - 12:00PM Dover Public Library Learning Center
I recently met with the city for our Downtown Dover Crosswalks Project and wanted to catch people up on where we are at with that initiative as well as explore ways to tackle some roadblocks the city has identified. We will be doing a workshop on five questions that we feel can help the city take action and ensure the plan’s success.
What types of materials and layout would create a safer crosswalk?
How can artists in the community be included to contribute to the space?
How can we help the city fundraise to help cover the cost of the project?
How can we engage the community to help build support for the project?
How can we measure the success of the project?
If those sounds like interesting questions that you want to help contribute to answering, we would love to see you at our next in-person meeting!
The Need for a Return on Public Investment
If we think about investing from a personal standpoint, we usually focus on trying to get a financial return on that investment. There is a consideration of the risk involved and a strategy to mitigate that risk so that the investment pays off. We need to making those same calculations with our public investments as well to ensure the long-term prosperity of the city and the people who reside in it.
If your city or town spends millions of dollars on maintaining a street, the water pipes, sewage pipes, storm water runoff, sidewalks, and other investments that make up that street, then the amount of money returned on that investment should more than cover the cost to the city. How does the city plan to recoup the cost of building all of that infrastructure? How does the city plan to afford the maintenance on all of those liabilities? These are serious questions that need to be considered before spending millions of dollars of public money. You might be able to get away with buying things you can’t afford for a while, but eventually it will catch up to you and we want to avoid that outcome for our communities.
Granted, some public investment is meant to make a financial return, but rather a communal return. Things such as parks, preservations, libraries, the arts, etc. will get various amounts of public investment that is not meant to be quantified as a return on dollars. As long as your city can afford those amenities, that’s fine to invest in those things. However, that underscores the importance of making sure that the city’s other investments such as streets, roads, water, sewer, etc. need to be more than financially sustainable, they need to be generating a positive return to the public in exchange for that investment.
Finding a Place for Public Investment
The main way our local governments pay for things would be with property taxes, and so we need to balance the amount of public investment to the amount on assessed private property values. We’ve talked in a previous article about measuring productivity of land using the value-per-acre method to help us find patterns that are wealth-creating. In this article I want to ask the question:
“Can we overlay value-per-acre with zoning codes as a guide for public investment?”
I took the idea to Paul Morris, a friend and member of our Strong Towns Seacoast group, and asked him to help me create a map that would accomplish this. The original goal was to see if zoning policy effectiveness could be measured, which I’ll admit was a pretty lofty goal and a big ask from me. A huge thank you to Paul for helping out with this and I think that the resulting map can be helpful for the city.
To fully realize the original goal, we would need a lot more information about the amount of current amount of public investment into each zoning code, which we don’t currently have. However, we do have access to the other half of the equation, the parcel map from which we can grab zoning codes and assessment values to help us find out how much taxable value each zoning code is currently generating. With that information in mind, perhaps it can be a guide to the city on where Dover as a city can get the most return for its public investment.
Taking a Look at the Map

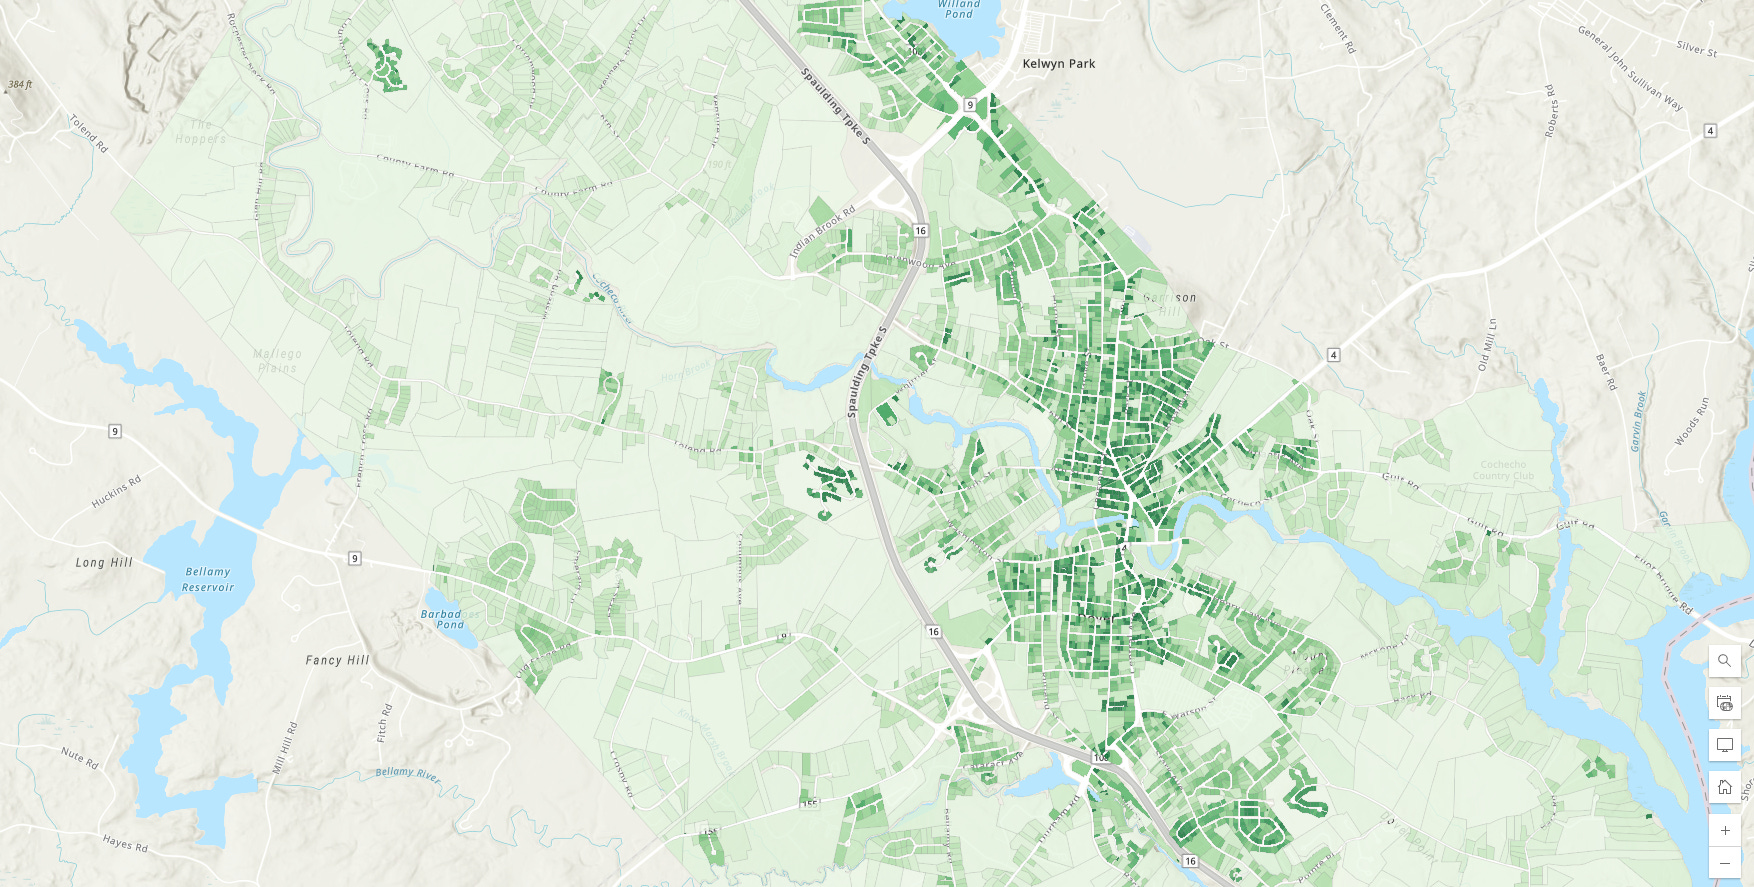
First, I want to say that we got our information from Dover’s parcel map website and while it is possible that there are some inaccuracies in our data, it is the the city’s own information that they choose to make public. So I felt confident that it was going to be relatively accurate. We were able to get the total value of the parcel, the acreage, and the zoning code to put together some metrics for the average value-per-acre for each zone. This gives the city is a tool for measuring how much public investment each zoning code can reasonably provide a return on.

Here we have the acreage that is covered by each zoning code and rural residential (R40) is in the lead with over 8000 acres which is about 4x the amount of the closest contender. It might be hard to read, but the downtown is divided into four different zoning codes that add up to around 170 acres on this map. The city is a finite amount of acreage and zoning codes will dictate what can be built on them, so it is important to understand how much of the city’s land is dedicated to which code.
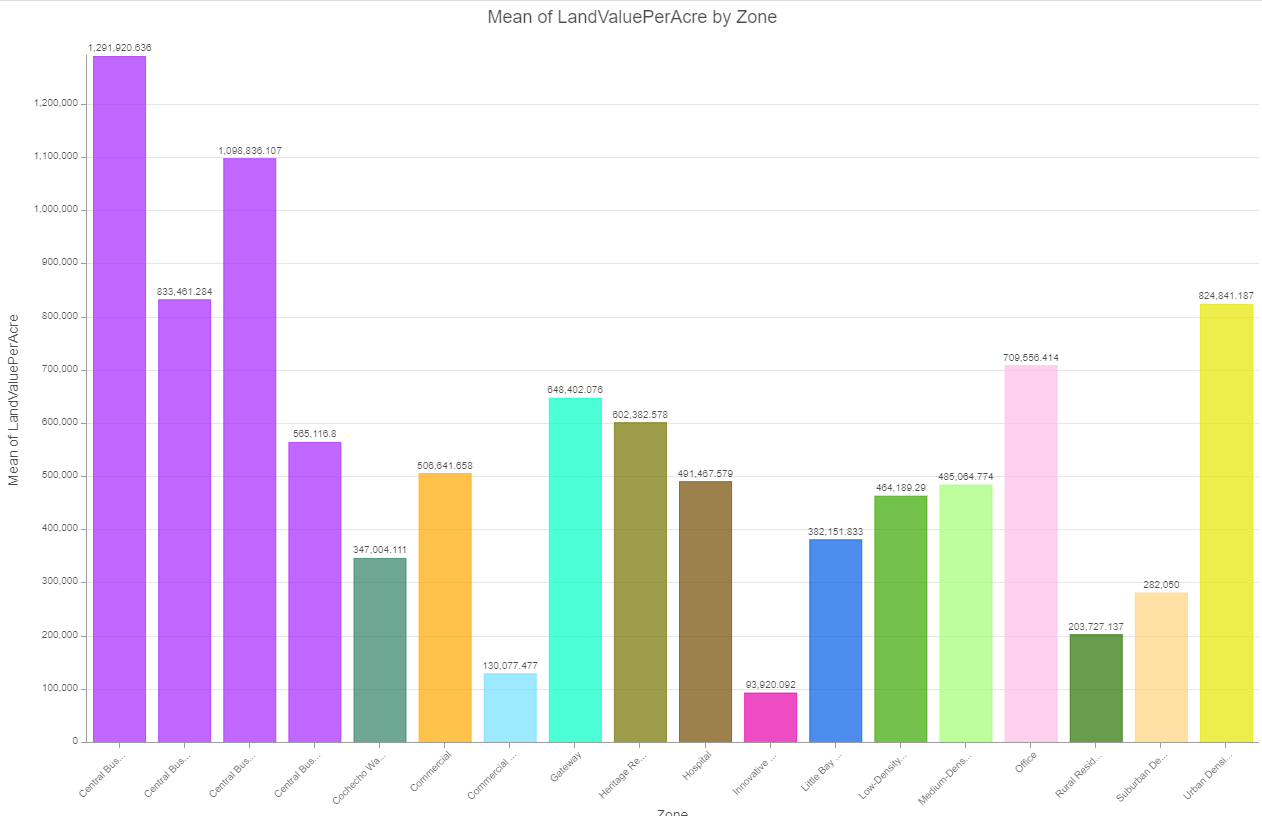
Now we have the average value-per-acre for each zoning code. Please note that this is an average, and each zoning code can have a variation of values within it. So, just by viewing this we can see that even though the downtown is a very small percentage of the total acreage, those few acres pack a massive punch. We can also see that the innovative technology (IT) code is the least in average value-per-acre in the list followed by commercial manufacturing (CM) and rural residential (R40). Something to consider when looking at this is that if the downtown zoning code has such a higher average value-per-acre, then should we assign more parcels to that code?
None of this is to say that those zones are bad or that we necessarily need to change them, that is not the argument that I am making. I am trying to highlight where our property tax money is coming from in regards to our zoning codes, with the hope that the city can use this information to make better, fiscally sound investments of public money that help grow the wealth of the community. I want the city to be able to balance how much money goes out, with how much money comes in. If the city does not do that, then the city is going to take a loss on its investments, which means that we are publicly funding places that cannot pay for themselves over time. That hurts the city and the community going forward.
Conclusion
That you for reading and I hope this topic was interesting to you and insightful. If you want to you can check out the map for yourself and look it over. Building a strong town means that our municipalities need to fiscally sound. If we can accomplish that, then fixing potholes is a matter of scheduling, not funding. Repairing streets and sidewalks is already within the budget and the surplus created let’s us focus on fully funding all the other amenities that we love and enjoy.
Hope to see you at the meeting on July 13th, we would love your input on how to make the Downtown Dover Crosswalks Project a success!