


Meeting # 9 - Measuring Productive Land Use
Identifying land use patterns that create more value for our communities

Welcome back to the Strong Towns Seacoast Newsletter and thank you for reading. I had quite a busy weekend going on and the pleasure of meeting some members of Seacoast Area Bike Riders (SABR). They are a non-profit focused on making the Seacoast region better for biking, and informed me of a program called Bicycle Benefits that lets participating businesses incentivize biking by offering discounts to people who bike to shop there. An interesting way of rewarding people who choose to cycle and hopefully will create more demand for cycling safety in our area. There are a few businesses around Dover with the Bicycle Benefits sticker up, so be on the lookout for it.
We also attended a casting off party for two friends who are members of our group who sold all of their furniture and will be living on their sailboat for the next year. They gave us a tour of their boat and it is impressive how much furniture can become a storage unit if you are really tight on space. We wish them luck and smooth waters in their adventure and will miss them while they are away.
Our topic for this month’s meeting was about measuring productive land use in your city or town. So, what do I mean when I say “productive”? Our cities have a finite amount of land available to them, and our local governments have an obligation to invest in that land for the productivity and prosperity of our communities. That investment comes in the form of streets, roads, water, drainage, sewage, policing, parks, etc. We all pay taxes for the purpose of helping the city to maintain those investments and to make new ones as the need/opportunity arises. While the city or town hall is the place to debate what types of investments a community would like to see made, I want to share a measuring tool with you to helpfully examine the return on investments that we are making into our land use.
How to Measure Value
How valuable is a piece of property to a community? There is a mix of public and private investment happening for most properties and the assessed value is what we base our property taxes on, so that can be considered a part of the return that we get from a private investment. With that in mind we might look at a Wal-Mart or a Target and see their assessed values in the millions of dollars and think that those are valuable investments. Strip malls similarly have large valuations, but just like other big box stores they have large footprints that take up lots of land.
Let’s compare a few properties to see how they stack up to each other. I’ve got 3 properties from Dover here, a mixed-use apartment building, a stand-alone restaurant, and a strip mall. Let’s list out what each one offers, how much land it takes up, and the combined value of the land and buildings from the Dover parcel map.

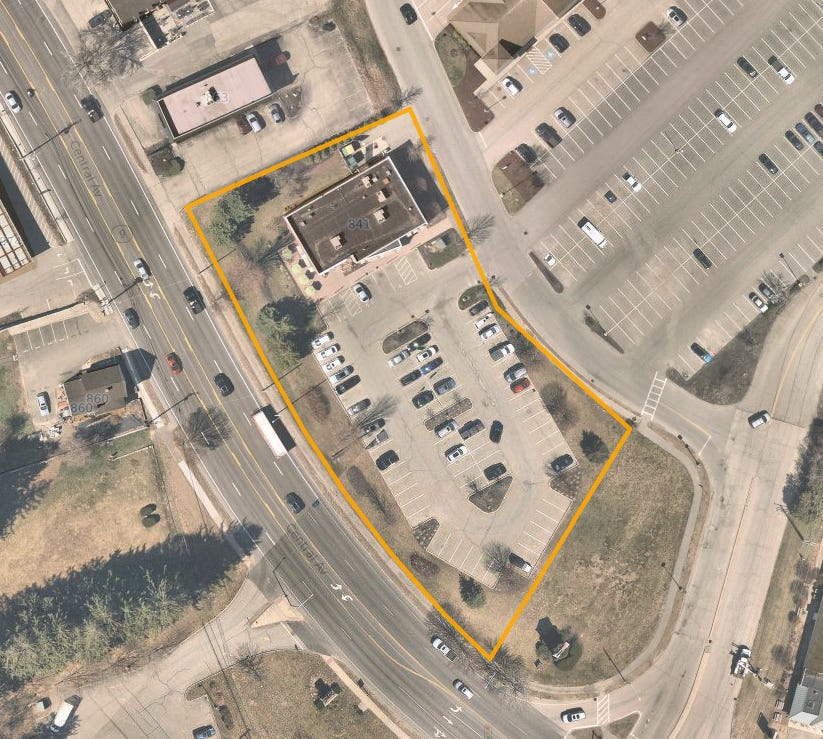
Third and Central Place
23 Residential Units (According to Apartments.com)
2 Commercial Units
0.74 Acres (Including parking)
Total Value = $6,820,300 (Including parking)
Panera Bread
0 Residential Units
1 Commercial Unit
1.39 Acres
Total Value = $2,208,800

Shaw’s Plaza
0 Residential Units
15 Commercial Units (Excluding standalone buildings)
15.46 Acres
Total Value = $22,921,100
Right off the bat we can see that Shaw’s Plaza is a highly valued parcel and also that neither it or Panera are providing any housing accommodations. Though, it does seem difficult to compare them because they each take up different amounts of land. We can more effectively compare these properties if we use value per acre instead of total value. So, let’s do some simple division and figure out how much value we are getting for every acre of land:
Third and Central Place
$6,594,000 / 0.39 Acres = $9,216,621.62 Value per Acre
Panera Bread
$2,208,800 / 1.39 Acres = $1,589,064.75 Value per Acre
Shaw’s Plaza
$22,921,100 / 15.46 Acres = $1,482,606.73 Value per Acre
Now that we’ve normalized those comparison values we can actually see that Third and Central Place has a much more productive use of its land than the other two. For the 0.74 acres of land that it takes up we get over 20 housing units, two commercial units, and a decent taxable value. By comparison, the other two are not using their land as effectively.
You can also see from the bird’s-eye images the difference in the amount of public investment surrounding each of the properties. Third and Central Place has a 2 lane street next to it and a smaller street frontage means less pipe for water and sewer to maintain. Shaw’s Plaza and Panera Bread are next to 5 lanes of asphalt and a signalized intersection and the street frontage will require more pipe to be run and maintained along with the storm water concerns of those large parking lots. While I’m sure there are things unaccounted for here, it seems clear that the larger acreage properties, even though they might have high values, are consuming more land and public investment than the smaller, mixed-use building.
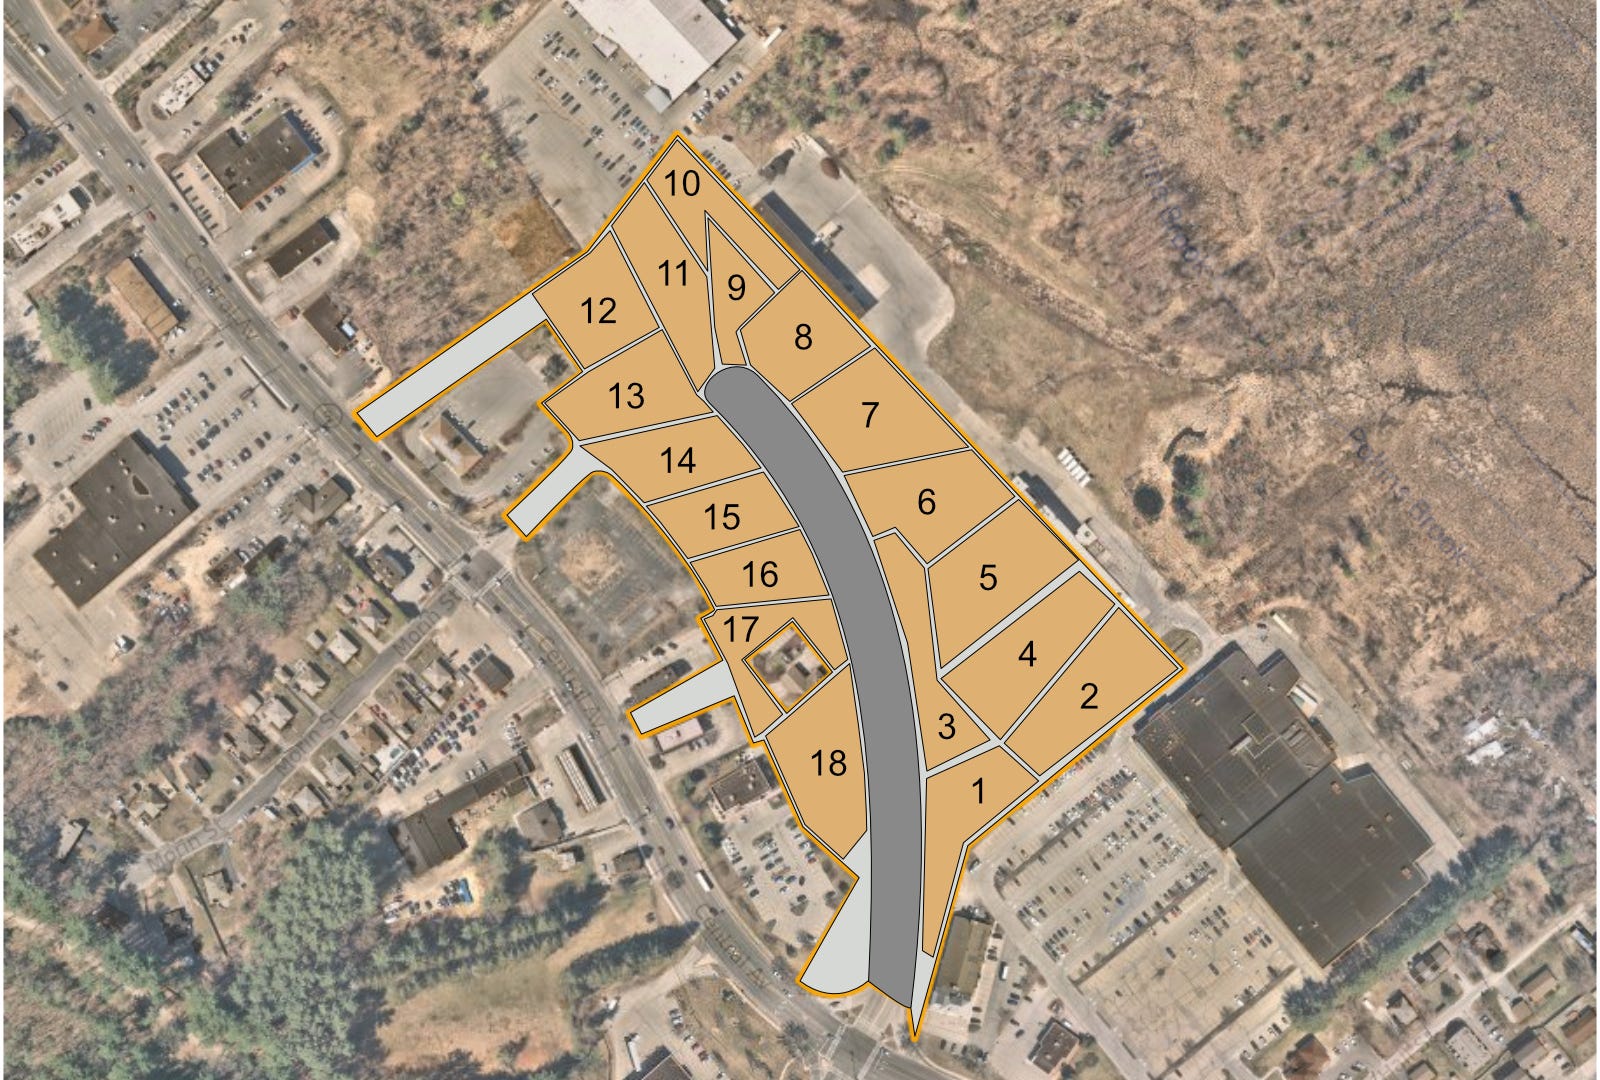
I put together this crude graphic to give an even clearer contrast. If you could somehow fill the 15.46 acres of Shaw’s Plaza with buildings similar to Third and Central Place and assuming similar values you would end up with these numbers:
15.46 Acres - 2 Acres (For a street and space between buildings) = 13.46 Acres
13.46 Acres / 0.74 Acres = 18.19 Buildings (Let’s round down to 18)
18 * 23 Units = 414 Residential Units
18 * 2 Units = 36 Commercial Units
18 * $6,820,300 = $122,765,400 Total Value
$122,765,400 / 15.46 Acres = $7,940,840.88 Value Per Acre
Of course that is a hypothetical and not a real world scenario, but the point remains. Focusing on productive land use can do a lot for our communities in the form of more housing, more businesses, and more tax revenue for roughly the same amount of infrastructure surrounding it.

Mapping Out Value-per-Acre
New Hampshire is actually fortunate to have a nearly complete map of value-per-acre analysis for the entire state with some highlighted cities from the Seacoast region. They even offer a ratio of land to value for the downtowns to help understand just how much value they are creating for our communities. You can see the ratios in these 3d visuals of Dover, Portsmouth, and Rochester and also note how clearly visible the downtowns are in these maps.

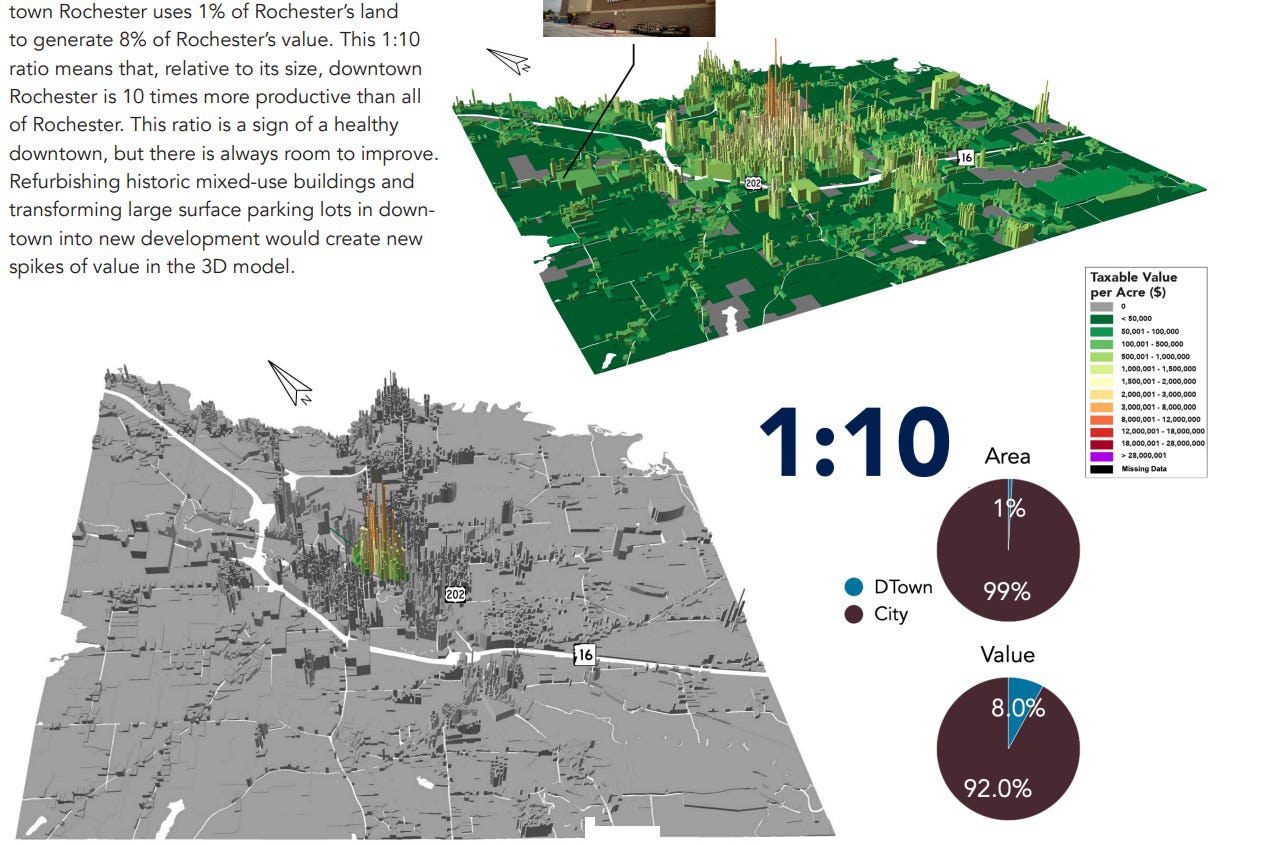

This analysis was done by a company called Urban3 and you can check out the full report for the state here: New Hampshire Urban3 Report. If you’re still curious about this topic you can also check out a video featuring the director of Urban3, Joe Minicozzi explaining the process and detailing the Seacoast region of the report.
Other Updates
In addition to that topic, we also discussed potentially modifying the newsletter by adding new sections or an alternative format to the blog post style that it has been. I am currently doing all of the writing myself and I want to continue doing most of that, but also want to open up opportunity for some other members of the group to contribute to the newsletter as well so that there is a broader range of topics and viewpoints.
We are also talking to the Dover Public Library about being added to their calendar and I am in the process of meeting some recently added requirements to the local conversations program to bring us up to date with the new standards. Strong Towns as an organization is trying to revamp the local conversations program, and has introduced a tiered system of requirements to be met and we are currently not qualified for tier one. I am working to address this.
Wrapping Up
This topic is a large part of the Strong Towns message. While most of our group’s topics have been focused on transportation patterns and safety, that is only one piece of their overall advocacy and I wanted to branch out and bring some of those other topics to our local conversation. I hope that this has got you thinking about some of the patterns that you see in your town and considering what are some ways to create more productive land use in your community.