


"One Death is Too Many"
Identifying the dangerous streets in our communities

Welcome back to the Strong Towns Seacoast newsletter, thank you for reading. Recently I was driving around the seacoast and saw a sign that said, “8 New Hampshire traffic deaths, one death is too many”. I’m not quite sure what time frame the 8 deaths occurred in, maybe it is within the past year or so, but I do think most of us reading would agree that one death is too many.
Though, sometimes it feels like traffic related deaths are unpreventable. Car crashes happen, and sometimes people unfortunately don’t survive. One death might be too many, but that’s just how it is or so we tell ourselves. Imagine if there was a theme park that had an average of just 1 death every year they operated. Would you go or take your kids to that theme park? Or, would you want to see the theme park make changes to become safer before you felt comfortable enough to go? Let’s make the same demand for our streets. What can we do to get to a place where we have zero deaths along our transportation network? Can it even be done?
First, I want to say that yes, it can be done and later in this article I will share an example of a city that has accomplished this and if we are willing to fully tackle the problems of dangerous streets maybe we can as well. Second, for us to achieve this goal we need to know where the dangerous streets are located. With the help of the Dover Police Department and a GIS (Geographic Information System) expert we were able to create a map of all of the vehicle crashes in the City of Dover in the past 5 years.
Meeting #7 Details
Saturday, March 16th 10:30AM - 12:00PM Dover Public Library Learning Center
This meeting will be a continuation from our last meeting where we looked at the downtown plans for the City of Dover and identified areas where we want to engage the city to take action. Since that meeting I have spoken with Chris Parker, who is the Deputy City Manager of Dover, and he offered me some advice on crafting a message and a strategy to approach the city with. Our goal for this next meeting is to discuss those items and solidify our plan of action to take to the city. If that sounds exciting to you, I hope to see you there as a part of the conversation.
Identifying Dangerous Streets and Roads
Our topic today concerns a map that was made by one of our meeting attendees, Paul Morris. I want to say thank you to him as well as the Dover Police Department, specifically Sergeant Marn Speidel in helping to create this map. I think that visualizing where collisions happen in our city can help us see much more clearly which streets in our communities are failing us by creating unsafe environments within our transportation system. We can then use that knowledge to take action on fixing them. After looking over the map, here are some things that I noticed where we might want to focus on.
Looking at the Data
In total Dover had 3,908 vehicle crashes between the years 2019 - 2023 that were reported to the police department and the vast majority of these incidents don’t result in any injury.

This means that in the past 5 years Dover has on average experienced:
2 crashes every day
1 crash that results in an injury every week
1 crash that results in a death every 15 months
Those are averages, and in fact if you look at the years that incidents occurred in you will find that some years had much fewer incidents than others. Let’s look more closely at the injuries and deaths and see where those are happening at. While many of the locations are spread out around the city I was able to highlight these intersections as the most dangerous:
9 Incidents - Central Avenue and Indian Brook Drive
7 Incidents - Indian Brook Drive and Weeks Lane
7 Incidents - Back River Road and Spruce Lane
6 Incidents - Silver Street and Locust Street
5 Incidents - Oak Street and Central Avenue
5 Incidents - Chestnut Street and 4th Street
Each of these intersections average at least once incident per year that results in injury and in the case of the #1 spot it is almost 2 per year. These locations are where we can get the most return on an investment in safety.
Deadly Chestnut Street
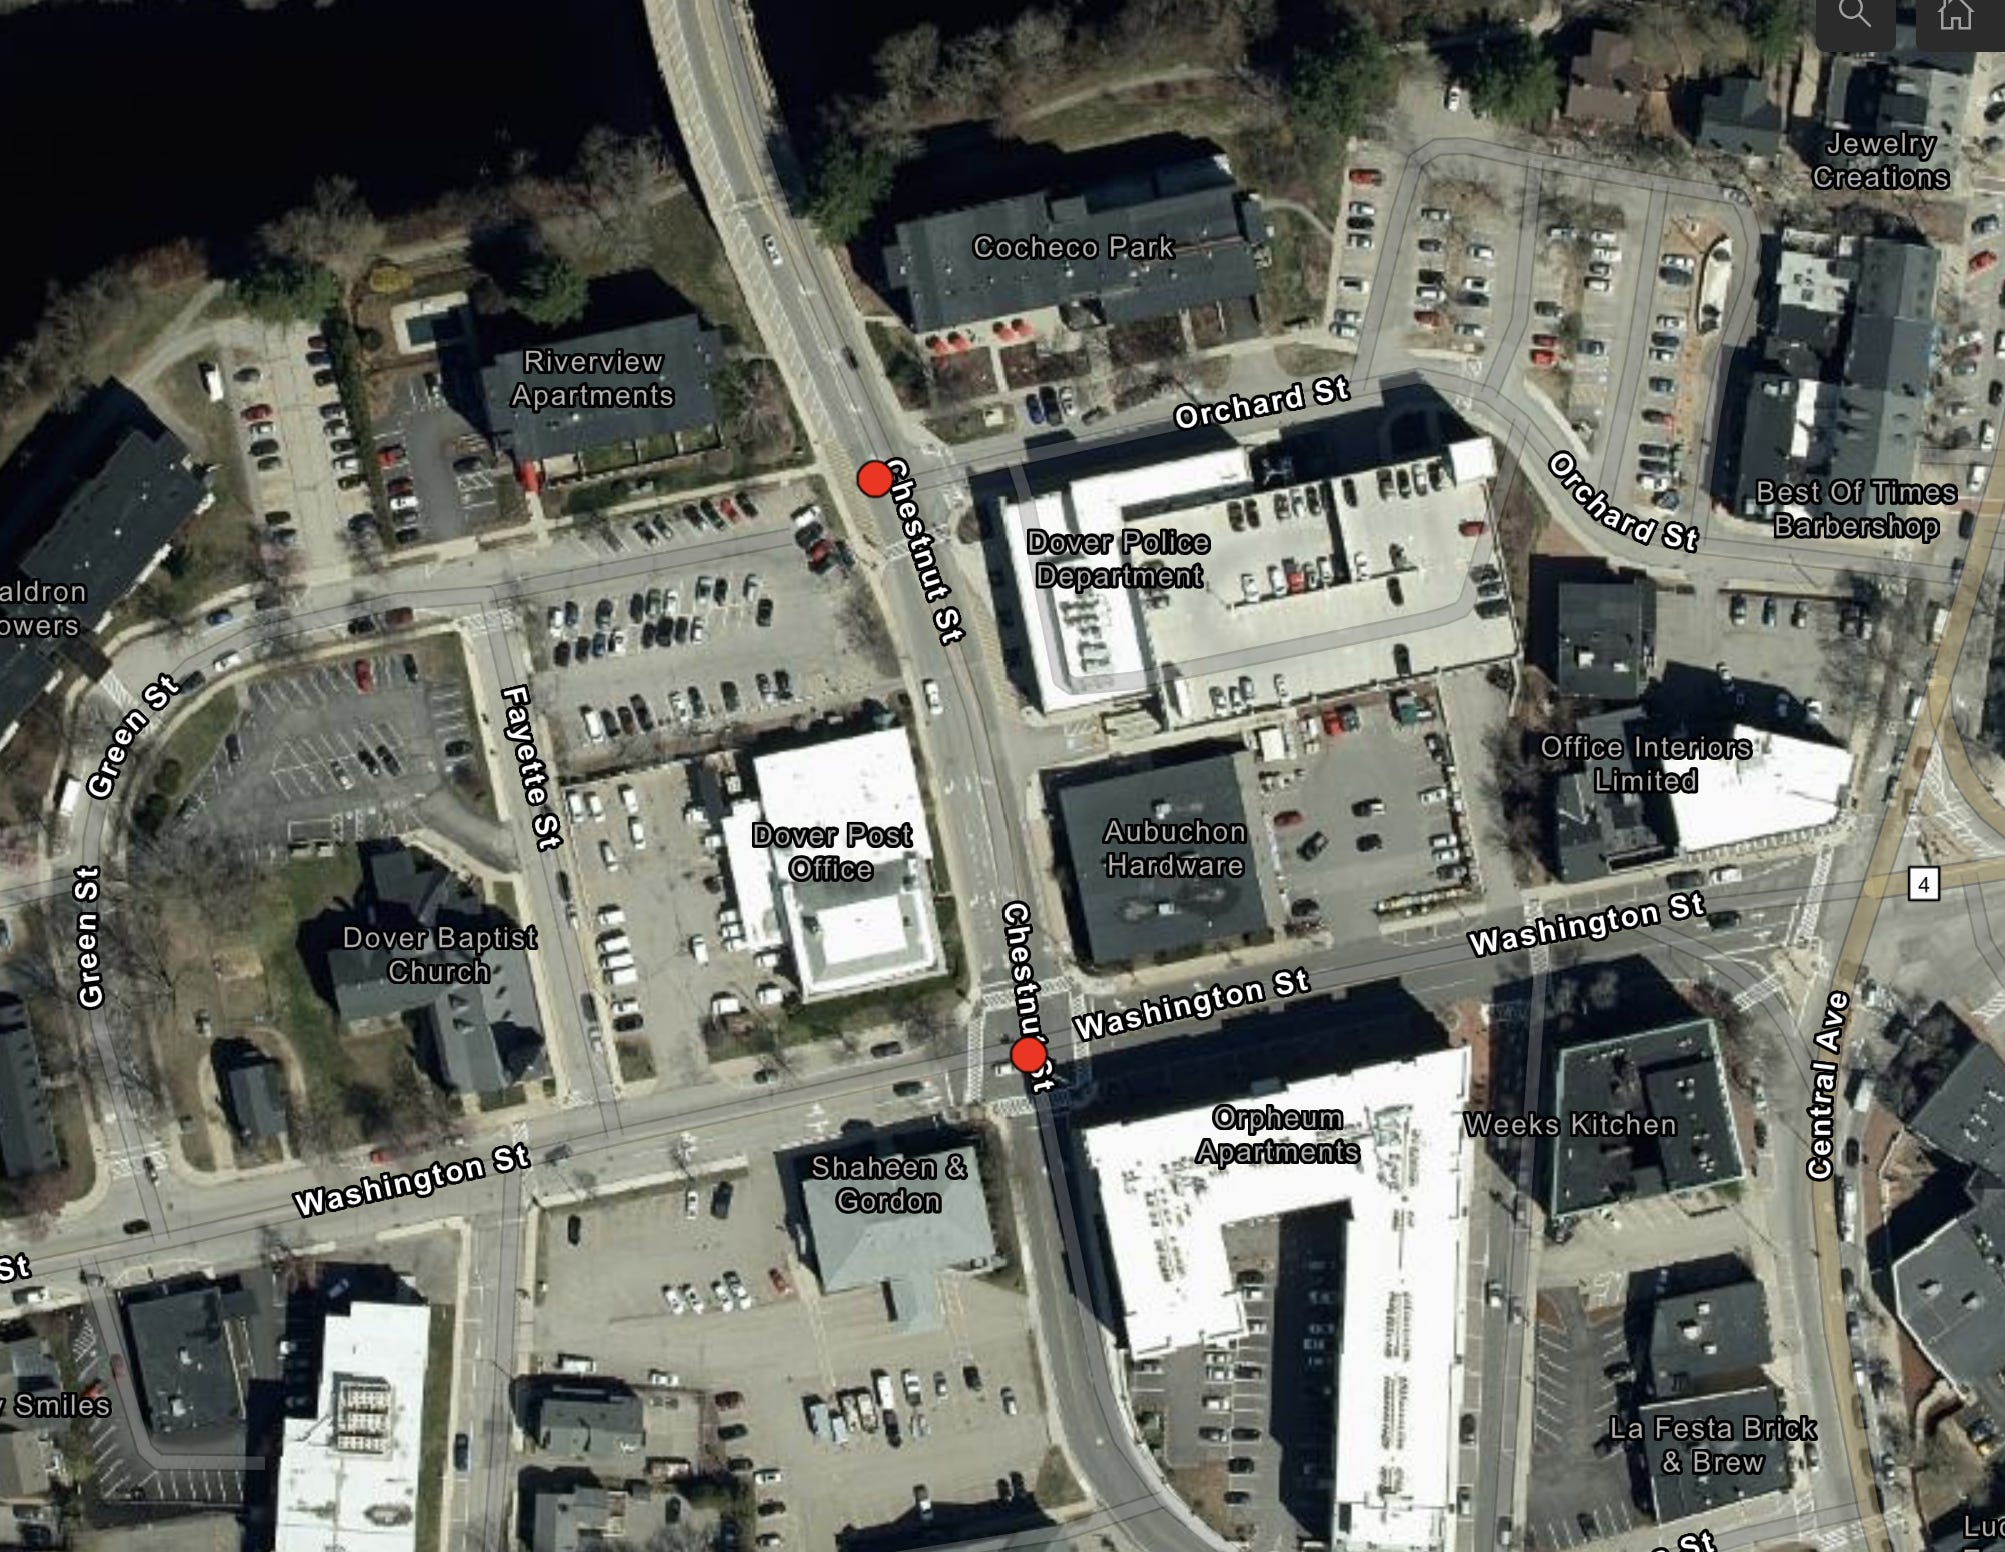
In the last 5 years, there have been 4 deaths from vehicle crashes and 2 of them have been on Chestnut Street next to the Dover Post Office and Dover Police Station. That should be concerning enough as it is, but if you look at the rest of Chestnut Street you can find another 10 incidents with injury occur along its route.
Indian Brook Drive and Central Avenue

Where Indian Brook Road and Central Avenue intersect was at the top of list of our dangerous intersections, but if you zoom out just a little you will see that there is more happening. There were a total of 27 incidents around this area, which is nearly 10% of all incidents with injuries.
Achieving Safer Streets
For nearly 7 years, Hoboken, New Jersey has had 0 traffic deaths. It isn’t just luck that has helped them avoid tragedy, they have been consistently focusing on making their streets safer to navigate by using a variety of techniques for crosswalks, intersections, and street design. The results speak for themselves and also are evidence that 0 traffic deaths is more than just aspiration, it is achievable. If we can focus on the areas of our city that need to be safer, areas that are currently dangerous and are an injury or a fatality waiting to happen, then we can start to move towards that goal as well.
Check It Out for Yourself
Here is a link to the map:
City of Dover Motor Vehicle Crash Map
Please check it out, browse it, and see what insights you can gather from it. If you come up with anything please comment or share it with me at AaronDanielWilliams@ProtonMail.com. I’d be interested to hear what other people notice that I might have overlooked.
Thank you so much for reading and I hope to see you at our next meeting!